
Setting up GOAD Blue team side in Proxmox
Introduction
GOAD is a pentest Active Directory LAB project. This lab provides pentesters with a vulnerable Active Directory environment for practicing attack techniques. However, the blue team side contains only logs from Winlogbeat. This field could be improved in various ways, but here is my setup to increase the visibility across the lab environment. Also, setting up the GOAD lab environment, was a bit challenging due to some issues while building it. I’m writing this because I encountered some issues while building the lab, and it’s great to have something as a reference for future deployments.
So let’s make the lab environment!
Day 1: RAID day
Why this was the RAID day?
My lab environment runs on a reliable, albeit aging IBM x3550 M4 server. Recently, after powering it on for the first time in a while, the system failed to boot following an unusually long initial check. Suspecting a potential RAID card issue, I opened the server case and carefully removed the RAID card and its connecting cables. I cleaned all components thoroughly to remove any dirt. After reassembling the server, I powered it on, and fortunately, that was the issue, and the system booted.
Network Diagram
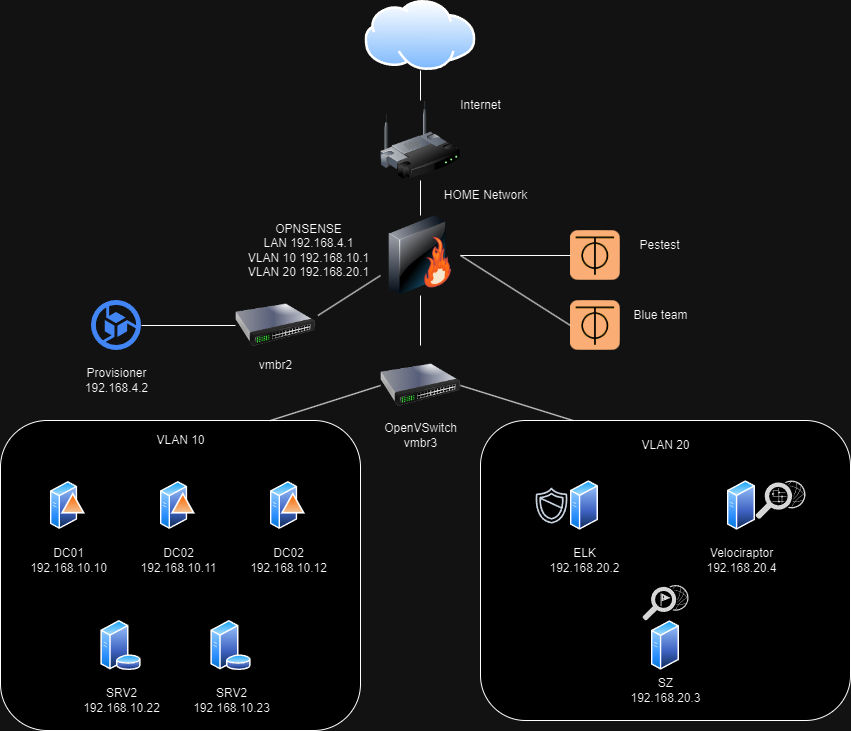
To clarify the network configuration, I consulted the official GOAD project on GitHub for the Proxmox lab environment (https://github.com/Orange-Cyberdefense/GOAD/blob/main/ad/GOAD/providers/proxmox/inventory). This resource confirms that the intended network range for the lab is 192.168.10.0/24. Additionally, the walkthrough mentions a reserved network segment of 192.168.20.0/24. Given this information, let’s leverage the reserved network of 192.168.20.0/24 to build our infrastructure.
Setup OVS switches
Creating OVS switches will be one of the most important steps in this lab setup. We will benefit from its mirroring capabilities later on. But first, let’s install the needed dependencies.
apt install openvswitch-switch
Set up a Linux bridge named vmbr2 for the OPNsense LAN before configuring the OVS switch.
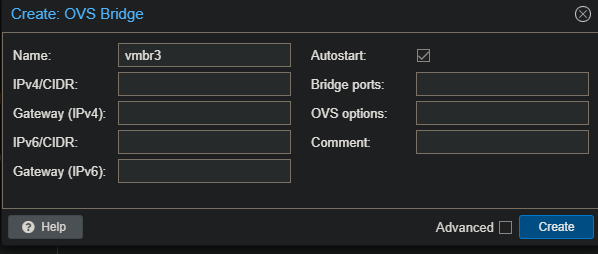
Once the OVS package is installed, create the vmbr3 bridge. In Proxmox, navigate to System -> Network and add a new OVS bridge. Name it ‘vmbr3’ and leave the remaining fields at their default values.
Network configuration (OPNsense)
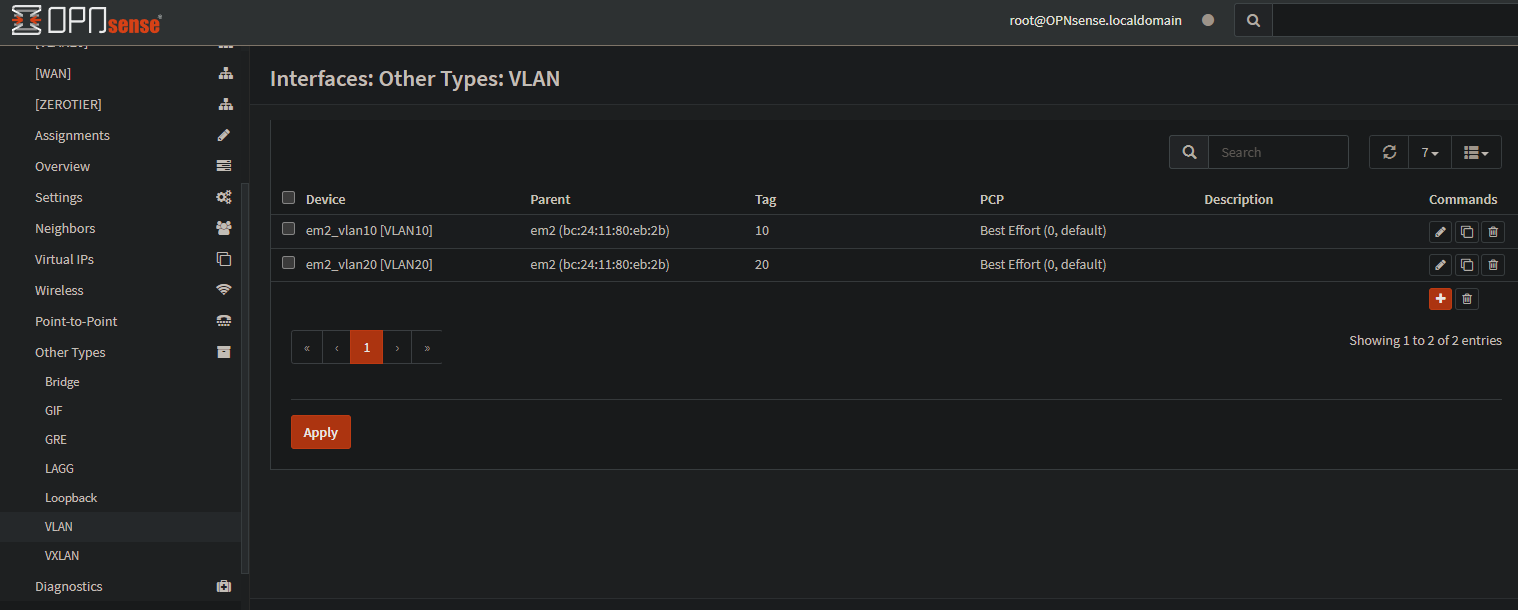
The network configuration for VLAN 10 (192.168.10.0/24) and VLAN 20 (192.168.20.0/24) will be fundamentally similar. However, this setup includes additional components:
- Two ZeroTier tunnels: One for pentesting and another for the blue team.
- An extra VLAN 20: Used to isolate the blue team infrastructure for enhanced segmentation.
- A LAN network (192.168.4.0/24) for vmbr2: Chosen to avoid conflicts with common home network addresses.
For the first setup, you will need a VM to access the LAN network of the OPNsense to do the initial configuration. For that, create a VM with a desktop environment and attach it to vmbr2. I will show you a trick to access the OPNsense web in the WAN address if the firewall is in the same network as your home network (like my case).
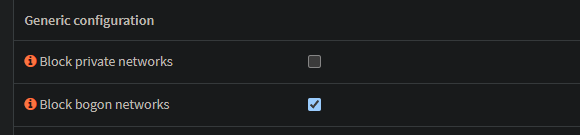
First, disable the check Block private networks on the WAN interface.
Then, go to Firewall -> Settings -> Advanced, and enable the check Disable reply-to on WAN rules.

In the Firewall -> NAT -> Port forward section, create a NO RDR rule to allow the traffic from your WAN net to your WAN address to port 443/TCP.

Finally, go to Firewall -> Rules -> WAN and create a rule that allows the traffic from your WAN net to your WAN address to port 443/TCP.

Note: Remember also to allow rule traffic in the VLAN 10 and VLAN 20 because we will need it to update and install the necessary packages during the setup ;).
ZeroTier Tunnel Setup
ZeroTier is the chosen VPN solution for setting up this lab due to its simplicity and easy deployment. Additionally, there’s no need to forward ports on the home router to grant someone else access to the environment, which prevents potential exposure to the internet and vulnerability to exploitation by a malicious actor.
To set up the ZeroTier VPN on OPNsense, first, navigate to System -> Firmware -> Plugins, and add os-zerotier using the plus button. Once installed, it should appear as installed. In the VPN section, ZeroTier should become visible.
In essence, to set up ZeroTier, follow these steps:
- Sign up on ZeroTier and create a network.
- Join OPNsense to the network using the network ID.
- Assign the interface on OPNsense with its corresponding IP address.
- Allow the required traffic for the tunnel.
- Add the necessary static routes to reach the lab.
Here is a video about how to setup ZeroTier on OPNsense that could be useful.
The networks that will be routed for the blue team are:
- 192.168.20.0/24
- 192.168.10.0/24
- 192.168.4.0/24
Alternatively, the red team will be able to reach only 192.168.10.0/24.
Creating Provisioning container (issue with setup_proxmox.sh script)
Similar to the original post I used an Ubuntu 22.04 container for the provisioning container, as described in the guide. I allocated 1 core and 1GB of RAM for this purpose. The interface should be vmbr2. Next, clone the GOAD repository to the root folder. I encountered an error when trying to execute the setup_proxmox.sh file.
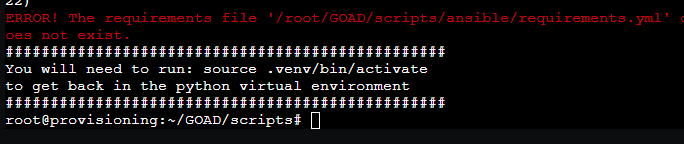
To resolve this, simply create the “ansible” directory and copy the “requirements.yml” file into it:
mkdir /root/GOAD/scripts/ansible
cp /root/GOAD/ansible/requirements.yml /root/GOAD/scripts/ansible/
Create Proxmox Pools
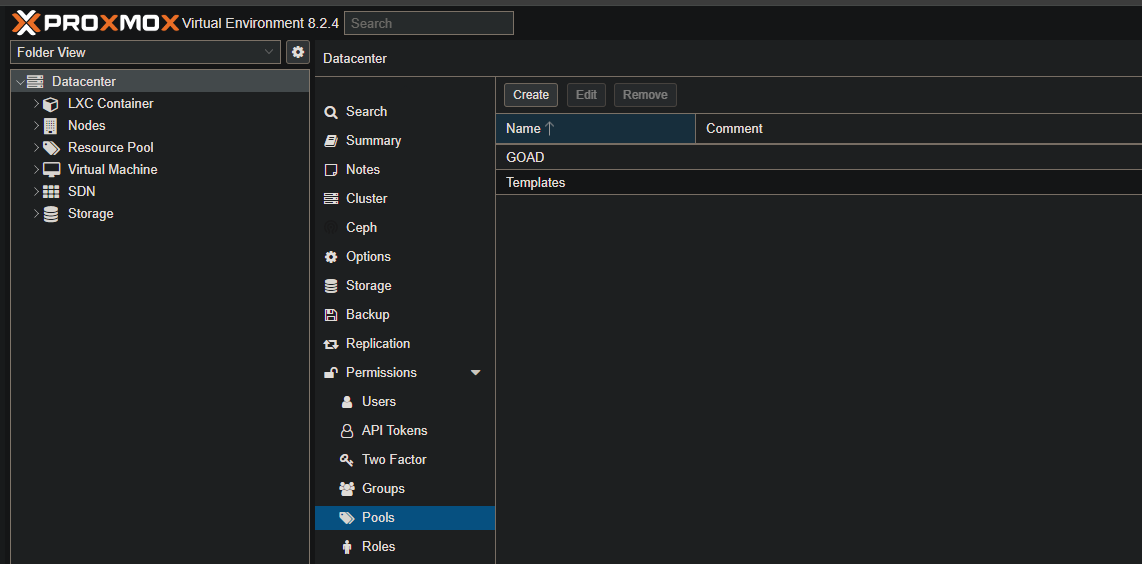
As per the Proxmox documentation, a resource pool is a collection of virtual machines, containers, and storage devices. It’s a useful feature for managing permissions, especially when certain users need controlled access to specific resources. Instead of managing permissions for each resource separately, you can apply a single permission to a group of elements. In the GOAD setup, we’ll primarily use pools to organize the environment. To create a new pool, go to the datacenter, then navigate to Permissions, and click on Pools. Create two pools: GOAD and Templates.
Packer: Edit storage format from qcow2 to raw
Alright. We have completed the first step. Now, let’s proceed to the second step. It’s crucial to ensure that the names of the ISO files you download match. If you need to rename the file, you can do so by navigating to /var/lib/vz/template/iso and renaming it there.
One crucial step is to set up the template for future provisioning. Make sure to modify the config.auto.pkrvars.hcl according to your requirements. Additionally, ensure that you select the correct storage type. In my case, it is local-lvm.
When creating the templates with Packer, I encountered an error stating that the qcow2 disk format was unsupported. Luckily, I found a post that explains that setting up with the raw format will make Packer start to work.
Tip: Enable ssh on provisioner machine
To run two Packer processes simultaneously, I recommend enabling SSH on the container. In my case, I enabled PermitRootLogin to log in as root on the container and complete the task. Now you can start creating your templates with Packer!
Tip 2: Use directly the Administrator role for the api user infra_as_code
An initial attempt to build the templates resulted in a permission error. To avoid this, let’s grant the infra_as_code user Administrator privileges. This will be required for subsequent Terraform deployments, so it’s efficient to handle it now.
pveum acl modify / -user 'infra_as_code@pve' -role Administrator
Tip 3: Increase timeout
Due to the age of the server and its extensive use over the years, it is not the fastest machine. This may cause timeouts. To prevent this issue, please edit ~/GOAD/packer/proxmox/packer.json.pkr.hcl and increase the timeout, for example, to 300 minutes.
Day 2
Edit terraform variables
We’ve finished the first two steps! Terraform should be a bit simpler, but there are important details to consider. The default configuration uses local storage. In my case, I’m using local-lvm, so I had to update the storage type in my variables.tf file (which you should have already copied from the template). You might need to adjust this based on your specific setup. Also, I built the Windows Server 2019 and 2016 so enable those by setting it to 1.
Launch goad.sh
After setting all the variables for Terraform, go ahead and launch the goad script as follows:
./goad.sh -t install -l GOAD -p proxmox
Elastic installation
Let’s set up the infrastructure for the blue team. To install Elastic, we’ll need to create a new VM with Ubuntu Server 20.04. There’s no specific reason for using a different version, so you can use whichever version works best for you. This machine has the IP address 192.168.20.2 as shown in the network diagram. The network interface should be in the vmbr3 with the VLAN tag 20. It will require 2 cores and 8GB of RAM to operate effectively. For simplicity, the username and password for this machine are ‘vagrant’ so that we can avoid having to modify the password in the Ansible configuration file. In the Ansible inventory file, it’s necessary to change the IP address for the elk. That can be changed in ~/GOAD/ad/GOAD/providers/proxmox/inventory. This is mostly done if, in the future, an ansible playbook would run in the ELK machine.
For the Elastic installation, I’ve chosen the quick setup method. By using elastic-container, we can quickly deploy a new Elastic instance, manage its policies through Fleet, and even integrate EDR into our hosts.
Please proceed with the installation by cloning the git repository to /opt, customizing the .env file, and then executing ./elastic-container.sh start. It’s important to enable the detection rules for Windows.
Ansible tasks for Elastic Agent instead of Winlogbeat
In this setup, we are not using winlogbeat directly to collect logs from the endpoints. We will manage this by using the Elastic Agent. We will modify the ansible part to distribute the Elastic Agent:
# elk.yml
# LOGS and Monitoring ==========================================================================================
#- name: Install ELK
#  hosts: elk_server
#  become: yes
#  roles:
#    - { role: 'elk', tags: 'elk' }

- name: Install log agent on windows vms
  hosts: elk_log
  vars:
    elastic_agent_version: "8.14.3"
    sysmon_download_url: "https://download.sysinternals.com/files/Sysmon.zip"
  roles:
    - { role: 'logs_windows', tags: 'agent' }
This modified configuration imports the task for the Elastic Agent and for the Velociraptor. We will see later the Velociraptor.
#roles/logs_windows/tasks/main.yml
- name: Install Elastic Agent
  import_tasks: elastic.yml

- name: Install velociraptor agents
  import_tasks: velociraptor.yml

- name: Create directory for Sysmon
  win_file:
    path: ""
    state: directory
  register: sysmon_dir_result

- name: Get Sysmon zip (adapt download_url and file_ext)
  win_get_url:
    url: ""
    dest: "/"
  when: not sysmon_dir_result.changed  # Download only if directory creation changed

- name: Unzip sysmon
  win_unzip:
    src: "/"
    dest: ""

- name: Copy Sysmon config (replace with your config file)
  win_copy:
    src: sysmonconfig-export.xml
    dest: c:\sysmon\sysmonconfig-export.xml

- name: check sysmon service
  win_service:
    name: sysmon64
  register: result
  failed_when: result is not defined
  ignore_errors: yes

- name: Run sysmon
  win_command: "\\sysmon64.exe -accepteula -i \\sysmonconfig-export.xml"
  args:
    chdir: ""
  when: result.state is not defined or result.name is not defined
The elastic.yml file handles the installation of the Elastic Agent on the endpoint. It creates an installation directory, then downloads the zip file containing the Elastic Agent, unzips it, and finally installs it with the specific parameters. Note: change the token variable to the policy that you want to add the agent to.
#roles/logs_windows/tasks/elastic.yml
# Install Elastic Agent on Windows

- name: Create install directory
  win_file:
    path: C:\elastic-agent
    state: directory

- name: Check if Elastic Agent service is installed
  win_service:
    name: elastic-agent
  register: elastic_agent_installed

- name: Check if Elastic Agent is using current version
  win_stat:
    path: C:\elastic-agent\elastic-agent--windows-x86_64
  register: elastic_agent_folder

- name: Download Elastic Agent
  win_get_url:
    url: "https://artifacts.elastic.co/downloads/beats/elastic-agent/elastic-agent--windows-x86_64.zip"
    dest: C:\elastic-agent\elastic-agent.zip
  when: not elastic_agent_installed.exists or not elastic_agent_folder.stat.exists

- name: Unzip Elastic Agent
  win_unzip:
    src: C:\elastic-agent\elastic-agent.zip
    dest: C:\elastic-agent
    delete_archive: yes
  when: not elastic_agent_folder.stat.exists

- name: Install and configure Elastic Agent
  win_command: powershell.exe -ExecutionPolicy Bypass -Command "& { C:\elastic-agent\elastic-agent--windows-x86_64\elastic-agent.exe install --url=https://192.168.20.2:8220 --enrollment-token=CHANGETOKEN --insecure -f }"
  args:
    chdir: C:\elastic-agent\elastic-agent--windows-x86_64
#  when: not elastic_agent_folder.stat.exists

- name: Start Elastic Agent service
  win_service:
    name: elastic-agent
    state: started
  when: not elastic_agent_folder.stat.exists
With the necessary files modified, we are ready to start running the Ansible playbook to provision the Elastic Agent. This can be achieved by executing the following command from the ansible folder:
ansible-playbook -i ../ad/GOAD/data/inventory -i ../ad/GOAD/providers/proxmox/inventory elk.yml
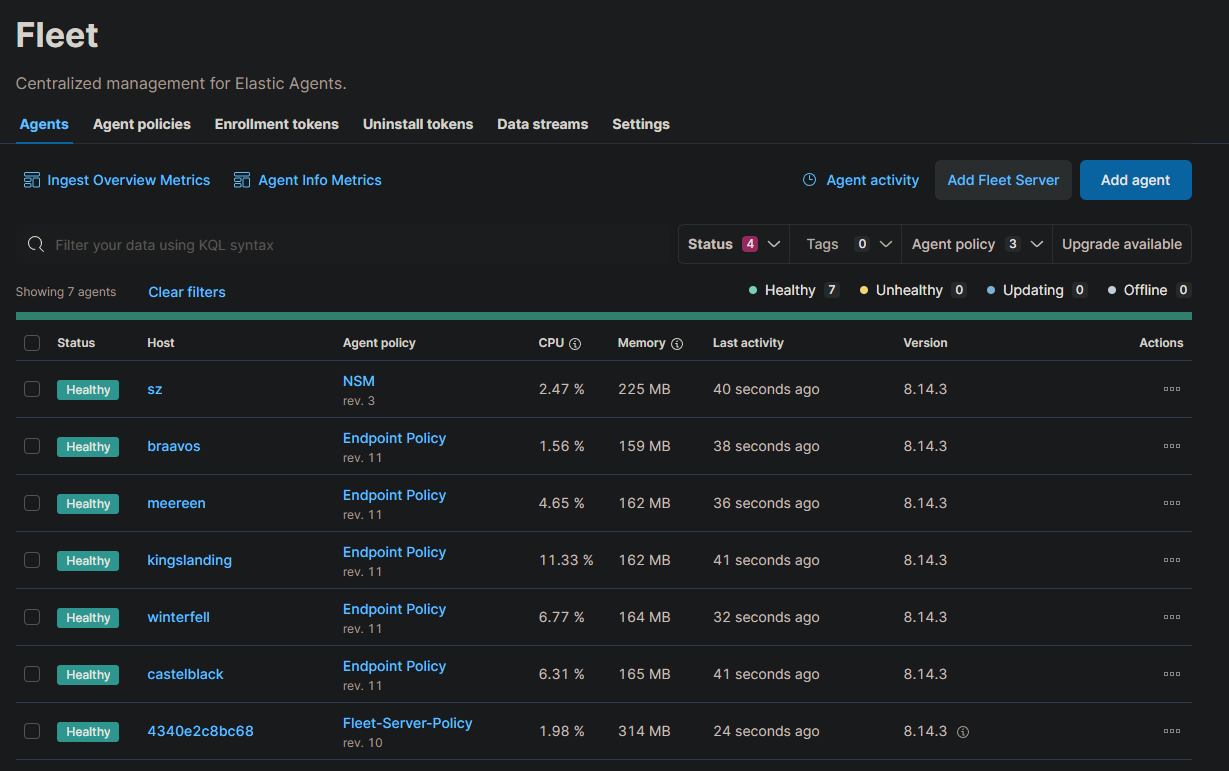
If all the agent installation goes right, we should see something like the following inside Elastic. Open Management -> Fleet -> Agents. Note: the SZ machine we will add it later.
SZ install
The SZ machine is just a shortened name for Suricata and Zeek. This will have Suricata and Zeek installed for traffic monitoring and alerting. Also, this will have two interfaces: one for administration and another for traffic monitoring. We can achieve traffic monitoring by creating port mirroring. As the Elastic machine, this will use 2 cores of CPU and 8 GB of RAM. As it needs two interfaces, these two will need to use the vmbr3 OVS switch to take advantage of its features. These two interfaces should have the VLAN tag 20. Also for simplicity, the username and password will be ‘vagrant’. Here is the hardware configuration:

Port mirroring
Here we are. This section is one of the most important for me. Port mirroring in Proxmox may seem complex, but it is easier than it looks. As previously mentioned, the OVS switch gives us the capability of creating a port mirroring inside Proxmox, so let’s add the port mirroring. The following post clarifies a lot of how this works.
ovs-vsctl -- --id=@p get port tap115i1 \
    -- --id=@m create mirror name=span1 select-all=true select-vlan=10 output-port=@p \
    -- set bridge vmbr3 mirrors=@m
Let’s break down the command. The first command retrieves the ID of the port tap115i1 and saves it into the @p variable. But why is the interface named like this? Where did you find that interface? You may ask those two questions. When you create the VM and assign the interfaces, tap interfaces are generated for each interface. We can identify that this interface is from VM 115 because it contains that number.
Additionally, the interface number is at the end of the name. If we still have questions, we can verify that the MAC address from the VM interface matches the one in Proxmox. To list all interfaces, you can use the “ip a” command.
The second part tells us to create a mirror with the name span1, get all the traffic from the VLAN 10, and output it to the port assigned in the variable @p (the interface where we capture the traffic). As you may remember, VLAN 10 is dedicated to the GOAD lab environment.
Finally, assign the bridge vmbr3 (the bridge that has the information that we want), to the mirror that we recently created, saved in variable @m.
To make it easier to launch, I created a script containing that command line and launched it whenever I needed to run it.
Excellent! The mirror is configured at the Proxmox level. Next, we’ll set up the interface to activate and enter promiscuous mode automatically when the SZ machine boots. This can be achieved by creating a service that executes a Bash script.
[Unit]
Description=Enable ens19 and set promiscuous mode
After=network.target

[Service]
Type=oneshot
ExecStart=/opt/int.sh
ExecStop=/usr/bin/ip link set ens19 promisc off
RemainAfterExit=yes

[Install]
WantedBy=multi-user.target
The Bash script will raise the interface and enable the promiscuous mode.
#!/bin/bash

# Enable the interface
ip link set ens19 up

# Set the interface to promiscuous mode
ip link set ens19 promisc on

exit 0
Suricata setup
Setting up Suricata is pretty straightforward. All the commands will be executed as root. First, install Suricata with apt using the following command:
apt install suricata
After installing, navigate to the file /etc/suricata/suricata.yml and modify the HOME_NET setting to be the following:
HOME_NET: "[192.168.10.0/24,192.168.20.0/24]"
To streamline the configuration, all references will be updated to use the secondary interface, “ens19”. This includes modifying the pfring section and any other relevant settings.
# ...
af-packet:
  - interface: ens19
# ...
pcap:
  - interface: ens19
# ...
netmap:
   # To specify OS endpoint add plus sign at the end (e.g. "eth0+")
 - interface: ens19
# ...
pfring:
  - interface: ens19
# ...
Open the /etc/default/suricata file for editing. This file determines which network interface Suricata will monitor for traffic. Locate the IFACE variable and set it to the desired interface.
# Interface to listen on (for pcap mode)
IFACE=ens19
To add additional rules to Suricata, we first need to update the sources. This process is similar to running an apt update to refresh Linux repositories but in this case, it’s for Suricata sources.
suricata-update update-sources
Listing the Suricata sources is as easy as updating them:
suricata-update list-sources
Let’s enable some of the available sources:
suricata-update enable-source et/open
suricata-update enable-source etnetera/aggressive
suricata-update enable-source sslbl/ja3-fingerprints
suricata-update enable-source sslbl/ssl-fp-blacklist
suricata-update enable-source stamus/lateral
suricata-update enable-source tgreen/hunting
Finally, enable and start the Suricata service.
systemctl enable suricata
systemctl start suricata
Zeek setup
The first step was to find a clear process for installing the software. For this purpose, I opted for the precompiled version available from the OpenSUSE repositories. You can find more information about it here. It’s worth noting that the repositories are designed for Ubuntu 22. However, I also tested it with Ubuntu 24 and encountered no issues.
Below is the bash script for adding the necessary repository and installing the software:
echo 'deb http://download.opensuse.org/repositories/security:/zeek/xUbuntu_22.04/ /' | sudo tee /etc/apt/sources.list.d/security:zeek.list
curl -fsSL https://download.opensuse.org/repositories/security:zeek/xUbuntu_22.04/Release.key | gpg --dearmor | sudo tee /etc/apt/trusted.gpg.d/security_zeek.gpg > /dev/null
sudo apt update
sudo apt install zeek-6.0
To manage your Zeek installation, start by accessing the Zeek control application. Once inside, proceed with installing Zeek and enabling the necessary cron jobs.
sudo /opt/zeek/bin/zeekctl
[ZeekControl] > install
removing old policies in /opt/zeek/spool/installed-scripts-do-not-touch/site ...
removing old policies in /opt/zeek/spool/installed-scripts-do-not-touch/auto ...
creating policy directories ...
installing site policies ...
generating standalone-layout.zeek ...
generating local-networks.zeek ...
generating zeekctl-config.zeek ...
generating zeekctl-config.sh ...
[ZeekControl] > cron enable
cron enabled
Zeek does not store logs in JSON by default. It is crucial to change this because, without the logs in JSON format, the Elastic Agent will not be able to collect the Zeek logs. You can modify this configuration by adding the following line to the file /opt/zeek/share/zeek/site/local.zeek:
@load policy/tuning/json-logs.zeek
Finally, like the previous one, enable and start the service.
systemctl enable zeek
systemctl start zeek
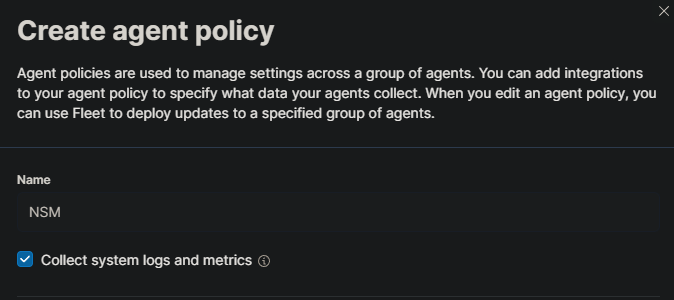
Join SZ with a new Elastic policy
In our SZ machine, we’ve installed Zeek and Suricata. It’s time to gather valuable information. To do this, let’s create a new Agent policy in Elastic. Go to Elastic -> Manage -> Fleet -> Agent Policies and click on “Create agent policy”. Name the policy “NSM” (Network Security Monitoring) there.
Great! Let’s add the necessary integrations for that policy. Click on the policy that we recently created and hit the “Add Integration” button.
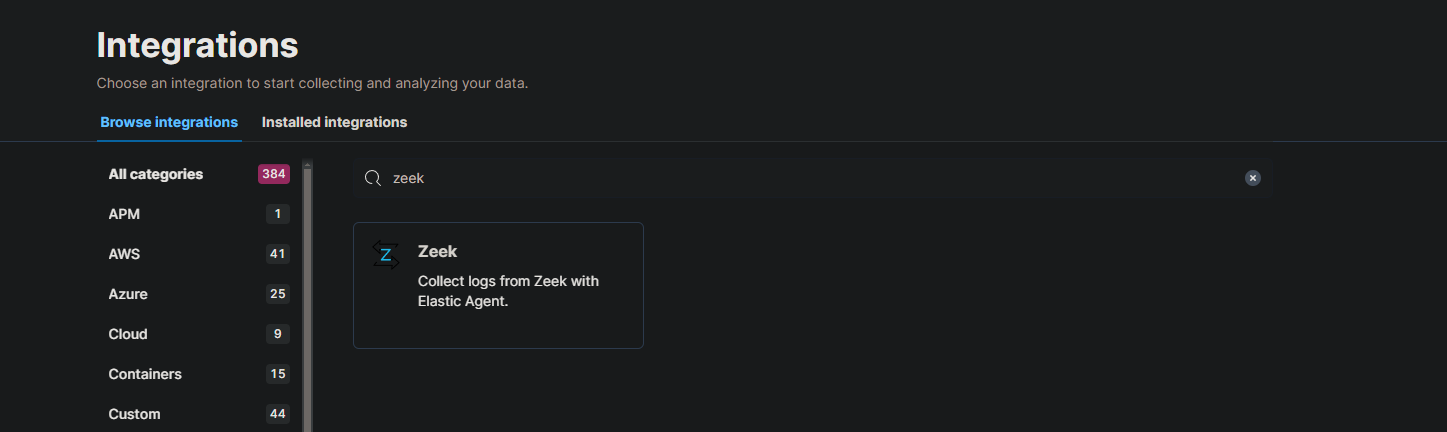
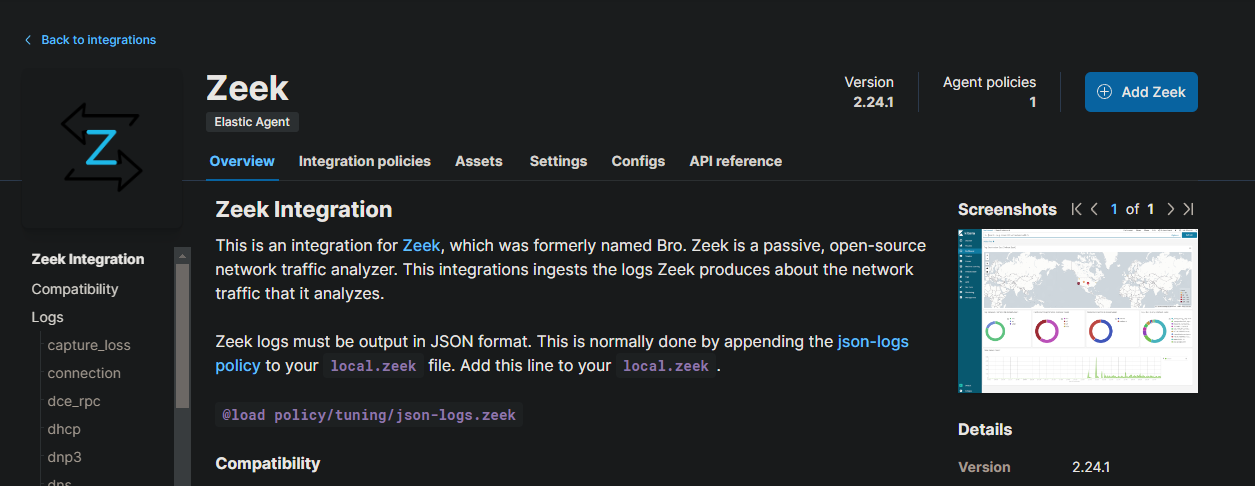
Now hit on the “Add Zeek” button.
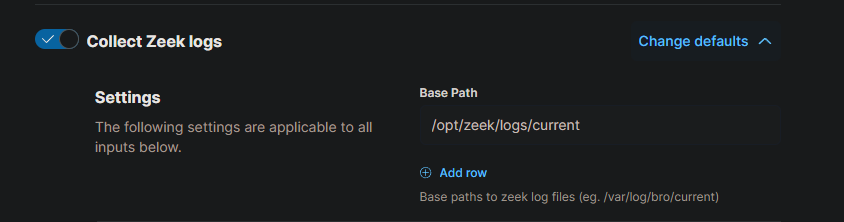
We can change the defaults of this integration. In this case, change the base directory for Zeek logs. There are two paths that we don’t need. Change it to look like this:
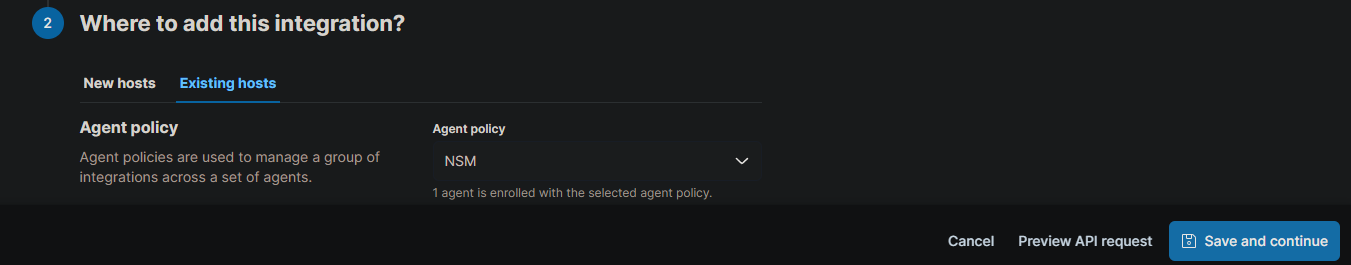
Finally, click the “Save and continue” button.
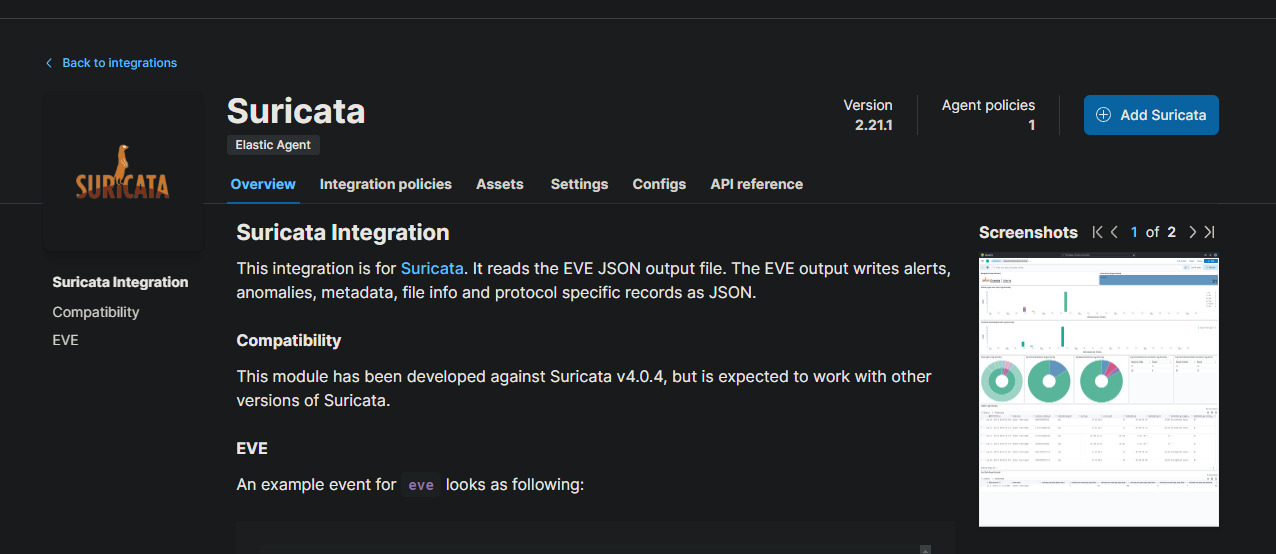
We will do the same with Suricata. Click on “Add Integration” and search for Suricata.
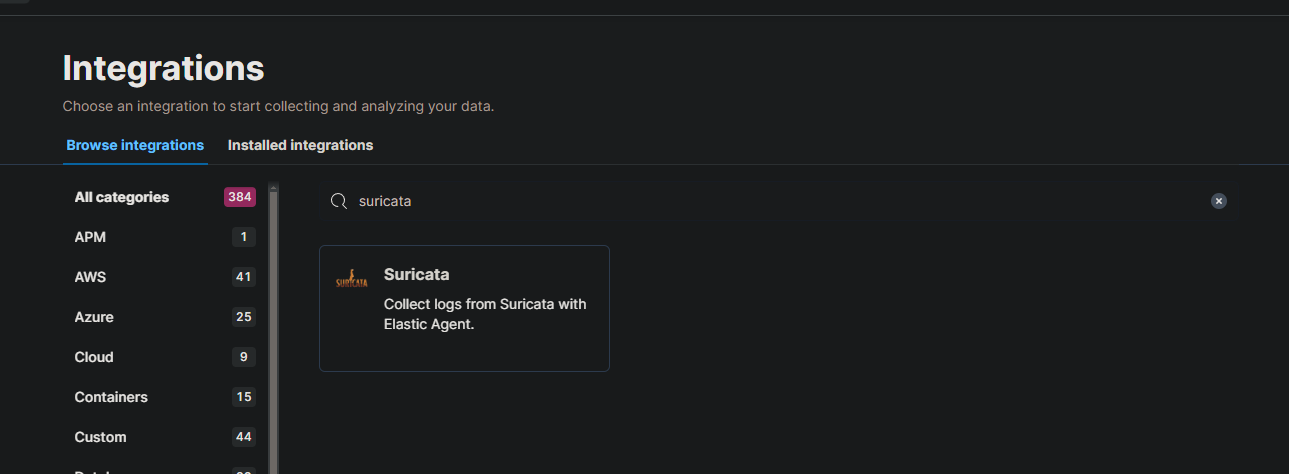
Go ahead and click on “Add Suricata”.
Here we don’t need to edit the defaults. Just make sure that you are adding this to the NSM policy that we recently created.
Finally, as the policy still doesn’t have any agents, go to the NSM policy, click on “Add agent” in the top right corner or click on the Actions button -> “Add agent”. Copy the command line for Linux, add the --insecure and -f parameters and execute it on the SZ machine. For example:
curl -L -O https://artifacts.elastic.co/downloads/beats/elastic-agent/elastic-agent-8.14.3-linux-x86_64.tar.gz tar xzvf elastic-agent-8.14.3-linux-x86_64.tar.gz cd elastic-agent-8.14.3-linux-x86_64 sudo ./elastic-agent install --url=https://192.168.20.2:8220 --enrollment-token=CHANGETOKEN --insecure -f
Day 3
Add integrations to Elastic policies
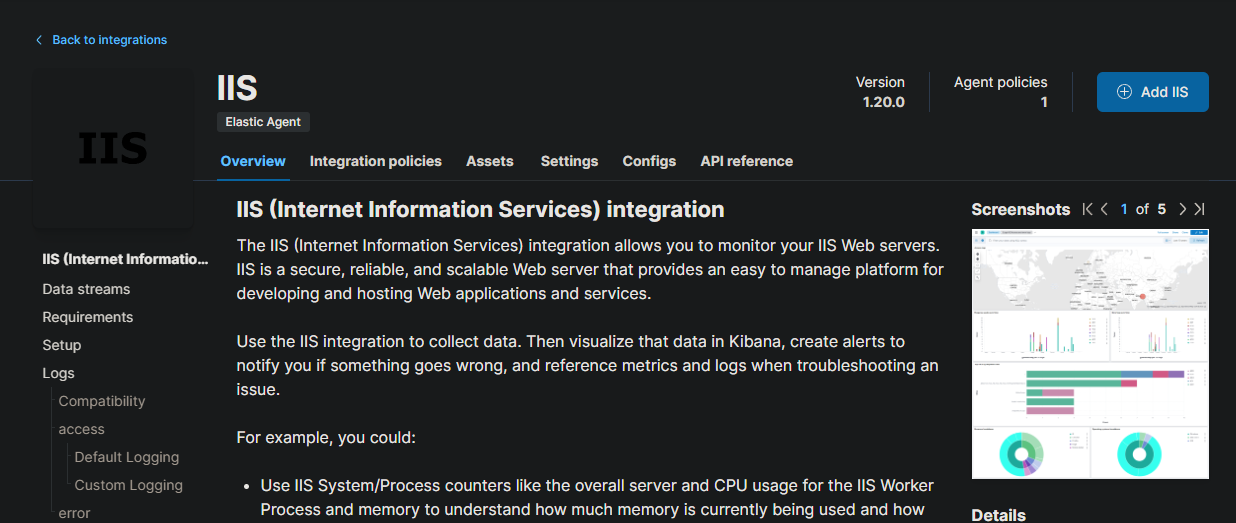
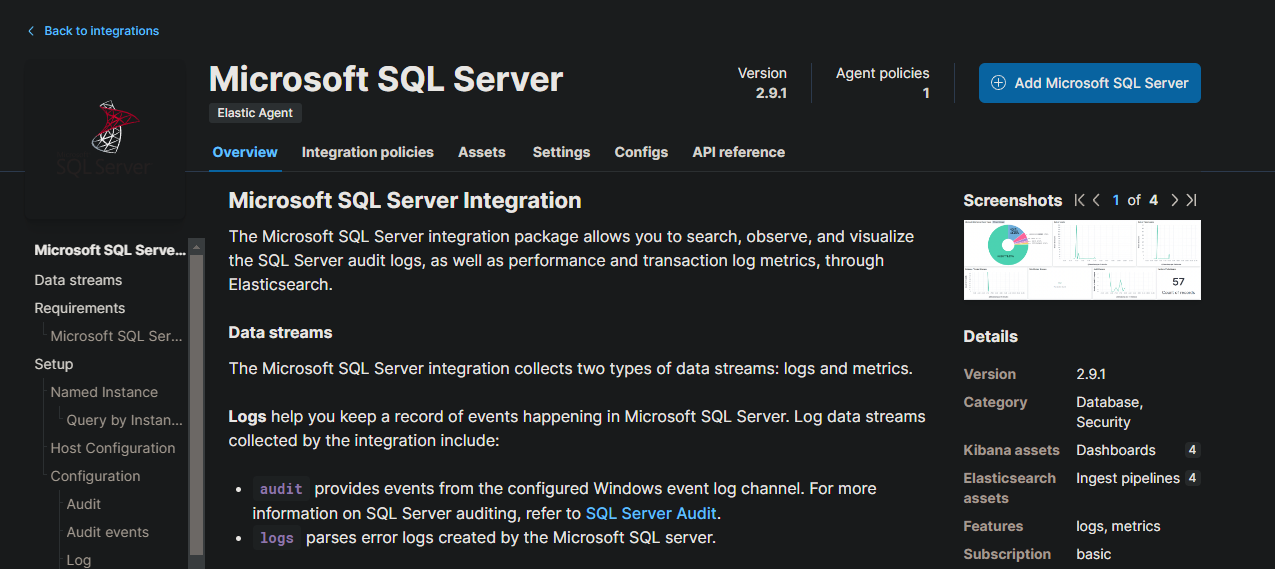
After three days of exploring the GOAD GitHub, we discovered that the lab machines were running IIS and MSSQL. To monitor the performance of these services and ensure everything is running smoothly, we implemented Elastic integrations.
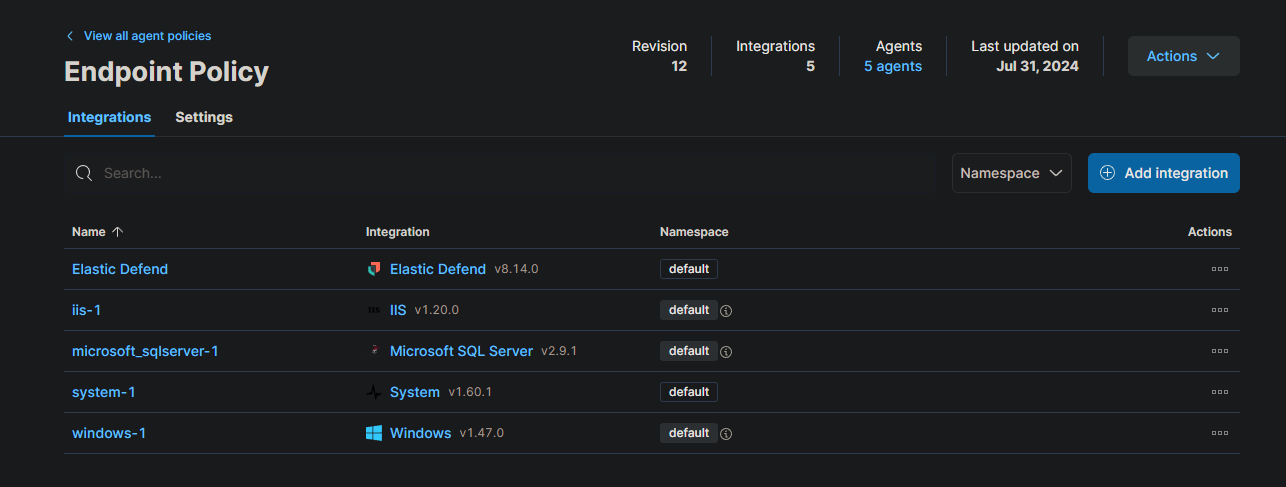
An IIS integration will provide detailed insights into the performance of our web servers, including their speed and incoming traffic. Utilizing customized dashboards, we can proactively identify and address any potential issues.
Integrating Microsoft SQL Server will allow us to monitor the database for any anomalies and ensure optimal performance.
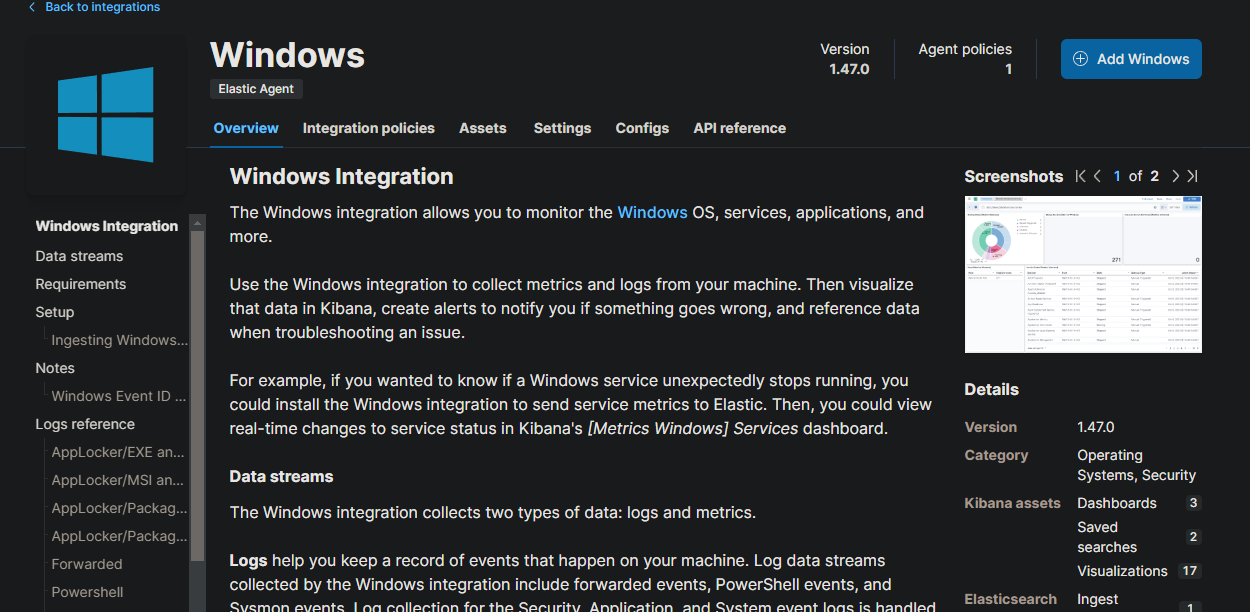
Lastly, a Windows integration will gather comprehensive system-wide information, focused on Windows event logs to collect critical information about what is happening on the system.
Velociraptor install
Installing Velociraptor could look difficult but is not. First, we must create a CT (container) in Proxmox to run our Velociraptor instance. For this machine, 1 Core and 4 GB of RAM should be sufficient. The network configuration will be 192.168.20.4/24 with the gateway 192.168.20.1. The network interface must be vmbr3 with the VLAN tag 20.
Add the required entries to the inventory files to run playbooks on the Velociraptor container. Remember that SSH is disabled by default in Proxmox containers, so you must enable it before proceeding.
Creating server and client packages
First, download the latest velociraptor binary.
wget https://github.com/Velocidex/velociraptor/releases/download/v0.72/velociraptor-v0.72.4-linux-amd64
Give the executable execute permissions.
chmod +x velociraptor-v0.72.4-linux-amd64
Generate the configuration files interactively needed for Velociraptor.
./velociraptor-v0.72.4-linux-amd64 config generate -i
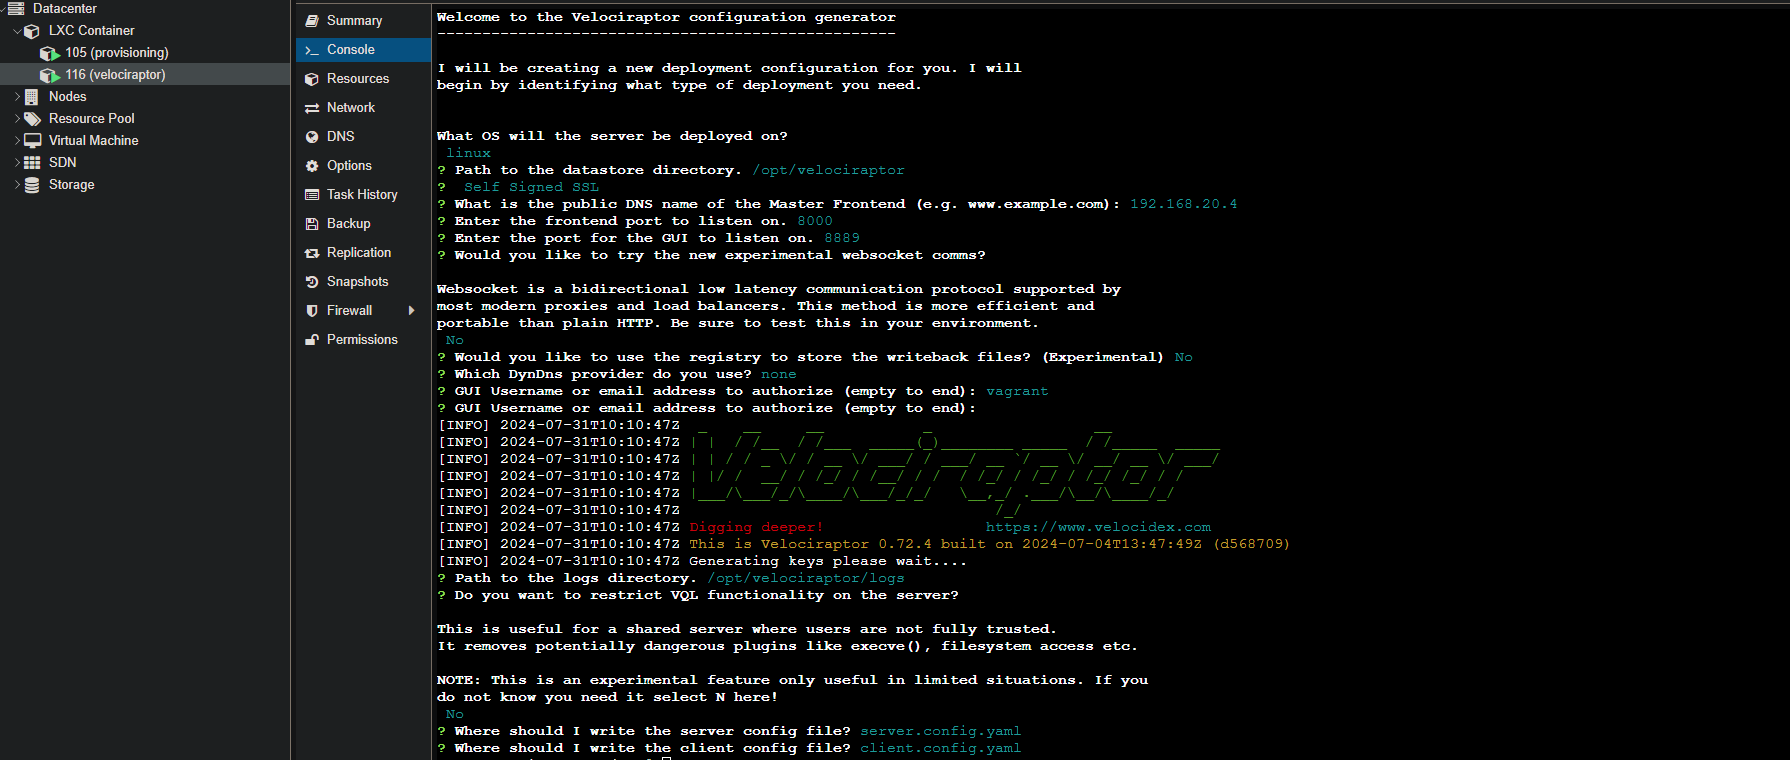
If we want the Velociraptor GUI port to listen on 0.0.0.0 instead of 127.0.0.1, we can change that in the server configuration that we generated.
# ...
GUI:
  bind_address: 0.0.0.0
  bind_port: 8889
# ...
Generating a server package for Debian-based systems can be accomplished by specifying the recently created server configuration and the previously downloaded binary.
./velociraptor-v0.72.4-linux-amd64 --config server.config.yaml debian server --binary velociraptor-v0.72.4-linux-amd64
Finally to install the server, use the dpkg command.
dpkg -i velociraptor_server_0.72.4_amd64.deb
To enable and start the service we can use systemctl with the enable –now parameters as follows:
systemctl enable --now velociraptor_server.service
All the hosts that we have to monitor, are windows. We will create a repacked executable that will contain the necessary information so the hosts can connect back to the Velociraptor instance.
First, download the executable for Windows.
wget https://github.com/Velocidex/velociraptor/releases/download/v0.72/velociraptor-v0.72.4-windows-amd64.exe
Create a new executable named “repacked-velociraptor.exe” by bundling the original executable with the client configuration file.
./velociraptor-v0.72.4-linux-amd64 config repack --exe velociraptor-v0.72.4-windows-amd64.exe client.config.yaml repacked-velociraptor.exe
Setup Ansible task for Velociraptor
It’s time to provision this new executable. Transfer the repacked executable to the provisioning machine to the directory /root/GOAD/ansible/roles/logs_windows/files.
In the previous Elastic Ansible configuration, there was a file called velociraptor.yml. Here is the configuration:
#roles/logs_windows/tasks/velociraptor.yml
- name: Create Velociraptor install directory
  win_file:
    path: C:\velociraptor
    state: directory

- name: Check if Velociraptor service is installed (placeholder)
  win_service:
    name: velociraptor
  register: velociraptor_installed  # This will always fail for Velociraptor

- name: Copy Velociraptor executable
  win_copy:
    src: repacked-velociraptor.exe
    dest: C:\velociraptor\repacked-velociraptor.exe

- name: Install Velociraptor service
  win_command: powershell.exe -ExecutionPolicy Bypass -Command "& { C:\velociraptor\repacked-velociraptor.exe service install }"
  when: not velociraptor_installed.exists  # This will always run
Essentially, this process involves creating an installation directory, copying the repacked velociraptor installer, and then installing the agent.
To provision these agents, we will use the same configuration file (elk.yml) as the Elastic agent.
ansible-playbook -i ../ad/GOAD/data/inventory -i ../ad/GOAD/providers/proxmox/inventory elk.yml
It is preferable to separate this into different files. This approach is suitable for quick deployment.
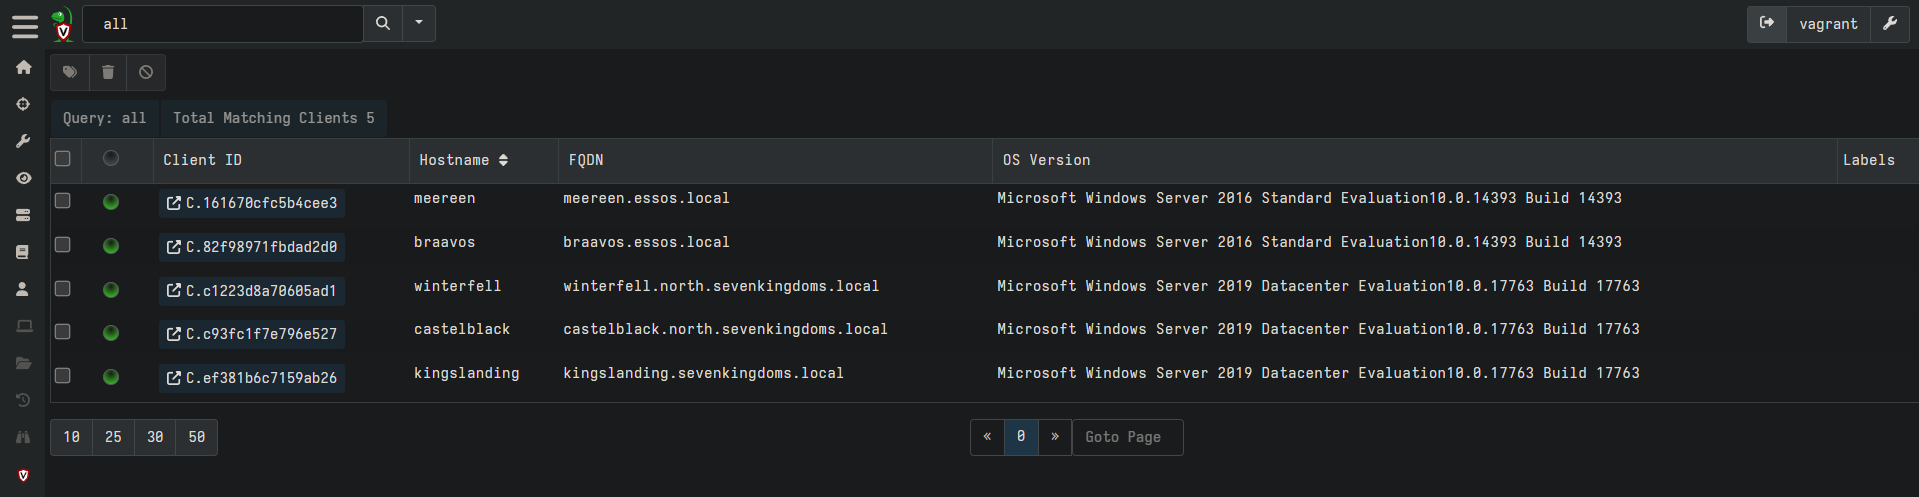
After the agents are installed, we can validate the installation by going to https://192.168.20.4:8889/app/index.html#/search/all.
Final thoughs
I’ve been looking forward to starting this project for a while, and I finally have the opportunity. Setting up GOAD will provide hands-on experience in using Packer, Terraform, and Ansible. This setup will be valuable for practicing Threat Hunting by launching attacks and gathering the necessary data to develop new detection rules.
Useful Resources
GOAD Elastic container Zeek Documentation Suricata Documentation Velociraptor Self Signed Velociraptor Deploying Clients GOAD setup walkthrough Koller ninja GOAD post ZeroTier OPNsense Documentation